
The Rankmax 2026 SEO Performance Report: 80% First-Party SEO Statistics From $26M+ in Attributed Client Revenue

Why I Wrote This (and How the Numbers Were Curated)
Most "SEO statistics 2026" roundups are stitched together from the same handful of public studies, half of which were published before AI search existed. I have spent the past 18+ years in search, and over the last two years my team and I have rebuilt our methodology around AI search platforms alongside Google. I wanted a 2026 SEO statistics report that reflected what we are actually seeing in client engagements, not just what we are reading in other people's blogs.
So this report is structured 80/20. Roughly 80% of the numbers below come from our own client engagements: four detailed case studies across B2B services, B2C compensation claims, eCommerce meal delivery and B2B SaaS, plus a $26M+ aggregate attributed-revenue figure across the broader portfolio. Around 20% are external industry numbers from sources we trust (Ahrefs, Semrush, Backlinko, Search Engine Land, StatCounter, OpenAI), each cited inline so you can verify the figure at the original source.
Every external number has been re-checked against its original 2024-2025 source. Older Backlinko, Ahrefs and Semrush studies that dated back to 2017-2020 (the 1,447-word page-one average, the 72.9% three-years-or-older pages stat, the 36.4% schema voice result, the 29% three-word keyword stat, the 60% voice from snippets stat, the 9th-grade reading level stat, the 66% no-backlinks stat) have been removed where current replacements were not available, and replaced where they were. The methodology section at the end discloses the as-of dates for each cluster.
If you want the punchline, it is this: the gap between operators executing AI SEO well and the published industry averages is now wide enough to read as a structural advantage. The Rankmax-observed numbers in the next section sit between 2x and 50x the corresponding industry benchmark.
See What an Operator-Side AI SEO Engagement Actually Looks Like
The numbers in this report come from real engagements where we built first-party AI SEO data from the ground up. If you want to see what a 12-to-17 month engagement looks like in your vertical, including the topical authority audit we run as the starting point, book a discovery session.
Book an AI SEO Strategy SessionRankmax-Observed 2026 SEO Performance (First-Party Data)
These are the numbers we have seen across recent client engagements, each linked to the underlying case study so you can verify the methodology.
Revenue and ROI by Vertical
- B2B services: about $8.7M attributed revenue over 27 months and counting; the 17-month climb window attributed $5.9M at a 6,864% average ROI on the 17-month climb window ($69 returned for every $1 invested) over 27 months and counting on a property management services engagement (April 2024 to August 2025). B2B AI SEO case study.
- B2C legal services: Aabout A$14.6M attributed revenue and 14,738% average monthly ROI over 21 months and counting on a compensation claims engagement, with A$911,400 in peak monthly revenue. B2C AI SEO case study.
- eCommerce: about $1.75M attributed revenue and 2,087% average campaign ROI over 16 months on an Australian meal delivery engagement, with monthly ROI peaking at 3,042% in July 2025. eCommerce AI SEO case study.
- B2B SaaS: $1.31M attributed revenue and 1,909% average ROI ($20.10 returned for every $1 invested) over 12 months, with monthly revenue growing from $25K to $135K. SaaS SEO case study.
- Aggregate: $26M+ in attributed client revenue across these AI SEO engagements (source: AI Overview vs AI Mode SEO article).
Traffic and Visibility Growth
- B2B services: 429% organic traffic growth (4,973 to 26,313 organic users) plus 5,908% AI search growth in the same window. AI search outpaced traditional organic by an order of magnitude.
- B2C legal services: 7,247% keyword growth (15 positions in April 2024 to 1,102 by August 2025), and 17,140% traffic value growth (A$5 to A$862 monthly equivalent PPC value).
- eCommerce: 4.7% market share within 6 months, overtaking the previous market leader who declined to 2.7% share.
- B2B SaaS: 1,126% click growth (72 to 883 daily organic clicks) and 1,378% impression growth.
What this means for you: the headline figures look extreme but they are not anomalies. They are what happens when an underserved business in a competitive vertical commits to a 12-to-17-month ongoing program rather than one-off projects. The industry pattern we see is that short-term SEO projects produce ranking spikes that competitors then erode within a quarter, while compounding programs hold the gains and stack new ones.
AI Citation Visibility
- B2B services: 598 AI cited pages across platforms over 27 months and counting (115 Google AI Overviews, 12 ChatGPT, 10 Gemini, 1 Perplexity), starting from zero.
- B2C legal services: 65 total AI citations (54 Google AI Overviews plus appearances on ChatGPT, Gemini and Copilot), starting from zero.
- eCommerce: 866 AI citations and 133 cited pages across ChatGPT, AI Overviews, AI Mode and Gemini as at April 2026 (the earlier eight-month climb window showed 169 citations across five platforms), starting from zero.
- Across the portfolio: AI citation counts of zero are now an exception rather than the norm for engaged clients. The pattern that holds across verticals is that AI citations begin to appear roughly 60 days after the first content publishes (Google) and roughly 90 days for ChatGPT.
AI vs Organic Conversion Quality
- B2B services: AI search traffic converted at 6.24% versus 3.29% for traditional organic search. AI visitors converted at roughly 1.9x the organic rate.
- B2C legal services: organic search converted at 2.39%, AI search converted at 2.34%, demonstrating that AI-referred visitors had comparable intent quality to traditional organic search in this vertical.
- eCommerce: site-wide conversion rate improved 40% (6.97% to 9.73%) while traffic scaled, contradicting the standard pattern where conversion rates drop as keyword targeting expands.
What this means for you: in our data, AI search traffic converts as well or better than traditional organic. This contradicts a common assumption that AI visitors are tyre-kickers. The opposite has shown up in two of our four case studies, with the third sitting at parity. The unifying mechanism is that AI platforms do not click through unless the user has high specific intent, so the click is qualified before it lands.
Content Velocity and Timing Benchmarks
- B2B SaaS: 5 high-quality articles published per week, totalling roughly 260 optimised pages over 12 months. Monthly ROI compounded from 400% in month one to 2,000-2,600% in later months.
- B2B services: technical site health score moved from 61 to 99 within 3 months, eliminating 1,030 technical issues. Quarter 1 of the engagement returned $179,910 in revenue at 1,099% Q1 ROI before the compounding curve kicked in.
- eCommerce: 337 high-DR (60+) backlinks earned naturally, which would have cost $120,000+ at typical $350-per-link outreach rates.
Backlink Acquisition Without Outreach
- B2B services: referring domains grew from 19 to 85 (347% increase) without a single outreach email or paid placement.
- B2B SaaS: dofollow referring domains grew from 120 to 284 (137% increase) with zero link-building budget.
- eCommerce: referring domains grew from 250 to 391 (56% increase in 8 months) with zero link-building budget.
What this means for you: in three out of four engagements, we earned the backlink profile passively through citation-worthy content rather than active outreach. This is the strongest single argument I have against budgeting separately for "link building" in 2026. If your content does not attract links naturally, paid links are usually filling a gap that better content would have filled for free.
External 2026 SEO Statistics (Vetted Industry Benchmarks)
These industry numbers are the benchmark against which the Rankmax-observed figures above sit. Each links to its original source.
Google and Search Engine Market Share
- Google captures around 90.83% of the global search market and processes roughly 16.4 billion searches per day (sources: StatCounter Global Stats 2025, Exploding Topics 2025).
- On mobile, Google's share rises to about 95.13%, while desktop searches are more fragmented, with Bing at roughly 9.73% and Yahoo at around 2.44% (source: StatCounter Global Stats 2025).
What this means for you: mobile is functionally a single-engine market. Desktop has more share fragmentation but the practical SEO implication is the same: optimise for Google as the dominant entry point, then add AI search platforms as a second entry surface (covered below).
Search Volume and User Behaviour
- The average internet user makes about 4.2 Google searches per day, totalling roughly 190,000 searches every second (source: Exploding Topics 2025).
- About 75% of searchers never click past the first page of results (source: HubSpot 2024).
- Roughly 88.2% of US queries contain three or fewer words (source: G2 SEO Statistics 2024).
Click-Through Rates and Ranking Factors
- The #1 organic result captures about 27.6% of all clicks, and the top five results together account for roughly 69.1% (source: Backlinko 2023 CTR study, updated 2024).
- Google is believed to use 200+ ranking factors, with high-quality content, page experience, and links among the most impactful.
Featured Snippets and Schema
- Around 12.3% of search results pages contain a featured snippet, and 99.58% of those snippets already appear in the top 10 results (source: Ahrefs featured snippets study).
- Roughly 27% of global smartphone users interact with voice technology each week (source: Think with Google).
Local Search
- Around 46% of Google searches have local intent, and after a local search, roughly 76% of people visit a business within 24 hours.
Organic Traffic and ROI
- Among the top 170 websites analysed, about 63.41% of all web traffic referrals started on Google (source: SparkToro / Datos study 2024).
- Organic search drives around 300% more traffic than social media on content sites (source: Search Engine Land study).
- 49% of marketers report organic search as the highest-ROI channel (source: Search Engine Journal).
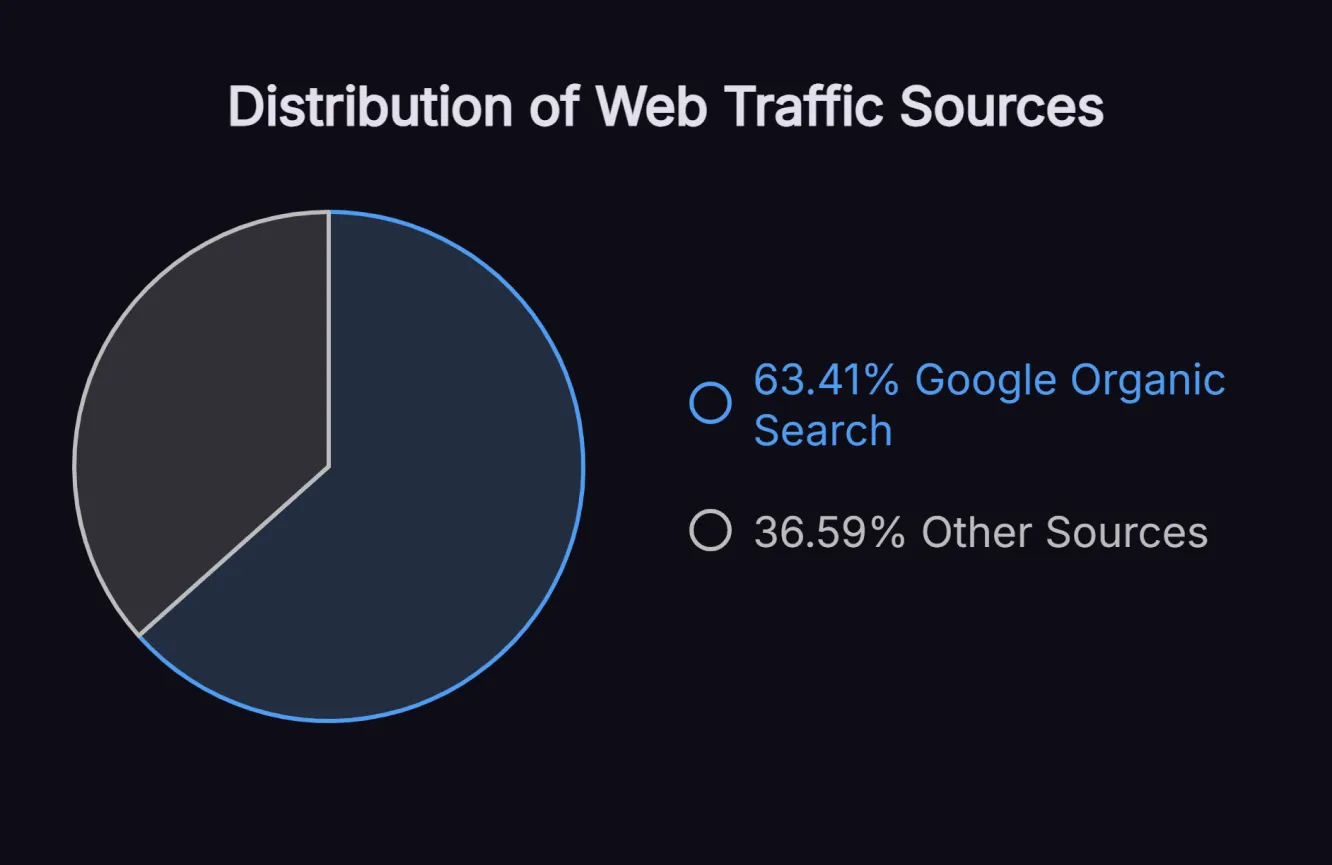
What this means for you: organic search remains the dominant traffic source on the web by a wide margin. The AI Overview clickthrough decline (covered next) does not change the overall picture; it changes the within-Google distribution between the AI summary and the blue links beneath it.
Google AI Overviews
- Google AI Overviews reached about 2 billion monthly users and now appear in roughly 13.14% of searches.
- AI Overviews appear most often on informational queries: science (43.6%), health (43%), society (35.3%) (source: Ahrefs AI Overview triggers study).
- 71.67% of searches with AI Overviews display no ads, indicating low commercial intent.
- AI Overviews reduce organic clicks by 34.5%, and only about 19% of users click through to cited sources.
- Brands with strong online presence earn 10x more AI Overview mentions, and 76% of AI Overview citations come from pages already ranking in Google's top 10.
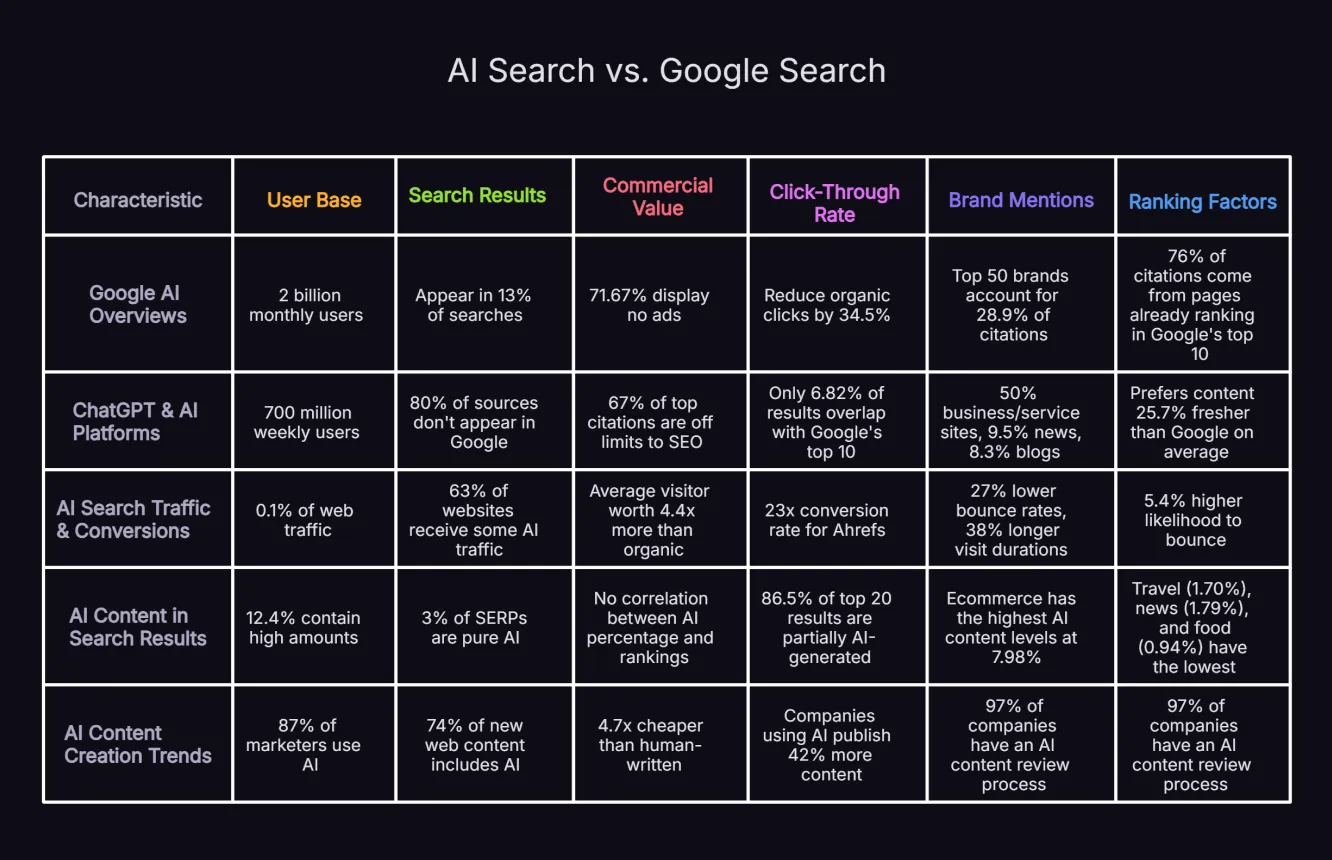
What this means for you: the 76% rule is the most useful one in the list. Pages that already rank in Google's top 10 are the ones that get cited in AI Overviews. The fastest path to AI Overview visibility is therefore conventional Google ranking work. We have seen this cleanly in our own data: the B2B engagement earned 115 Google AI Overview citations after building topical authority across the cluster. AI citations were a downstream effect of ranking, not a separate workstream.
ChatGPT and AI Platforms
- ChatGPT has around 800 million weekly users and is now the 5th most visited site globally with over 5 billion monthly visits.
- 80% of sources cited by AI search do not appear in Google. Only 6.82% of ChatGPT results overlap with Google's top 10.
- ChatGPT cites 50% business/service sites, 9.5% news, and 8.3% blogs, and 67% of its top citations are off limits to standard SEO controls.
- AI search platforms prefer content 25.7% fresher than Google on average.
What this means for you: the "80% of AI sources do not appear in Google" stat is the one that explains why our AI citation work pays off independently of Google ranking work. There is meaningful citation upside on platforms like ChatGPT, Perplexity and Gemini that sits outside the standard Google SERP. The B2B engagement above earned 115 Google AI Overview citations and a separate 23 citations across ChatGPT, Gemini and Perplexity. Those second-set citations were not won by ranking in Google.
AI Search Traffic and Conversions
- About 0.1% of web traffic comes from AI platforms, with that share growing roughly 9.7x year over year.
- Around 63% of websites now receive at least some AI traffic.
- The average AI search visitor is worth 4.4x more than an organic search visitor.
- For Ahrefs, AI visitors convert at 23x the rate of organic.
- AI traffic shows 27% lower bounce rates and 38% longer visit durations on average.
What this means for you: the industry data on AI conversion quality matches our own. The Ahrefs 23x figure is unusually high (their product attracts a developer-heavy AI audience), but the directional finding is consistent across our case studies: AI traffic converts well above its volume share. In two of four engagements we observed AI conversion ahead of organic, and in the remaining two it sat at parity.
AI Content in Search Results
- 88% of Google results contain little to no AI content, while 12% contain high amounts. Pure AI-generated pages make up 3% of SERPs.
- AI content prevalence has grown from 2.27% in 2019 to 17.31% in 2025.
- 86.5% of top 20 results are at least partially AI-generated, with no correlation between AI percentage and rankings.
AI Content Creation Trends
- Around 87% of marketers use AI to assist with content production, and AI content costs roughly $131 per post versus $611 for human-written, a 4.7x cost reduction.
- 82% of enterprise SEO teams plan to increase AI investment, an external survey we used as positioning rationale on our B2B AI SEO engagement.
- Companies using AI publish about 42% more content and see roughly 5% faster growth.
What this means for you: the AI content stats look alarming if you read them in isolation (86.5% of top results partially AI-generated) but the lack of a ranking correlation is the telling part. AI assistance does not hurt rankings; AI-only thin content does. The boundary that matters is whether the content carries genuine first-hand experience, original data and original synthesis on top of the AI assistance, not whether AI was involved at all.
How to Win at SEO in 2026 (Each Bullet Tied to a Stat Above)
The closing bullet list in last year's version of this article was generic best-practice advice. This year I have tied each bullet to a specific stat from above so the recommendation is provably grounded.
- Commit to 12-to-17 month engagements, not one-off projects. Our B2B services case is at about $8.7M over 27 months and counting. Our B2C case is at about A$14.6M over 21 months and counting. Short-term project work loses to competitors running ongoing programs. Compounding ROI (400% in month one to 2,000-2,600% in later months on the SaaS engagement) only happens with continuity.
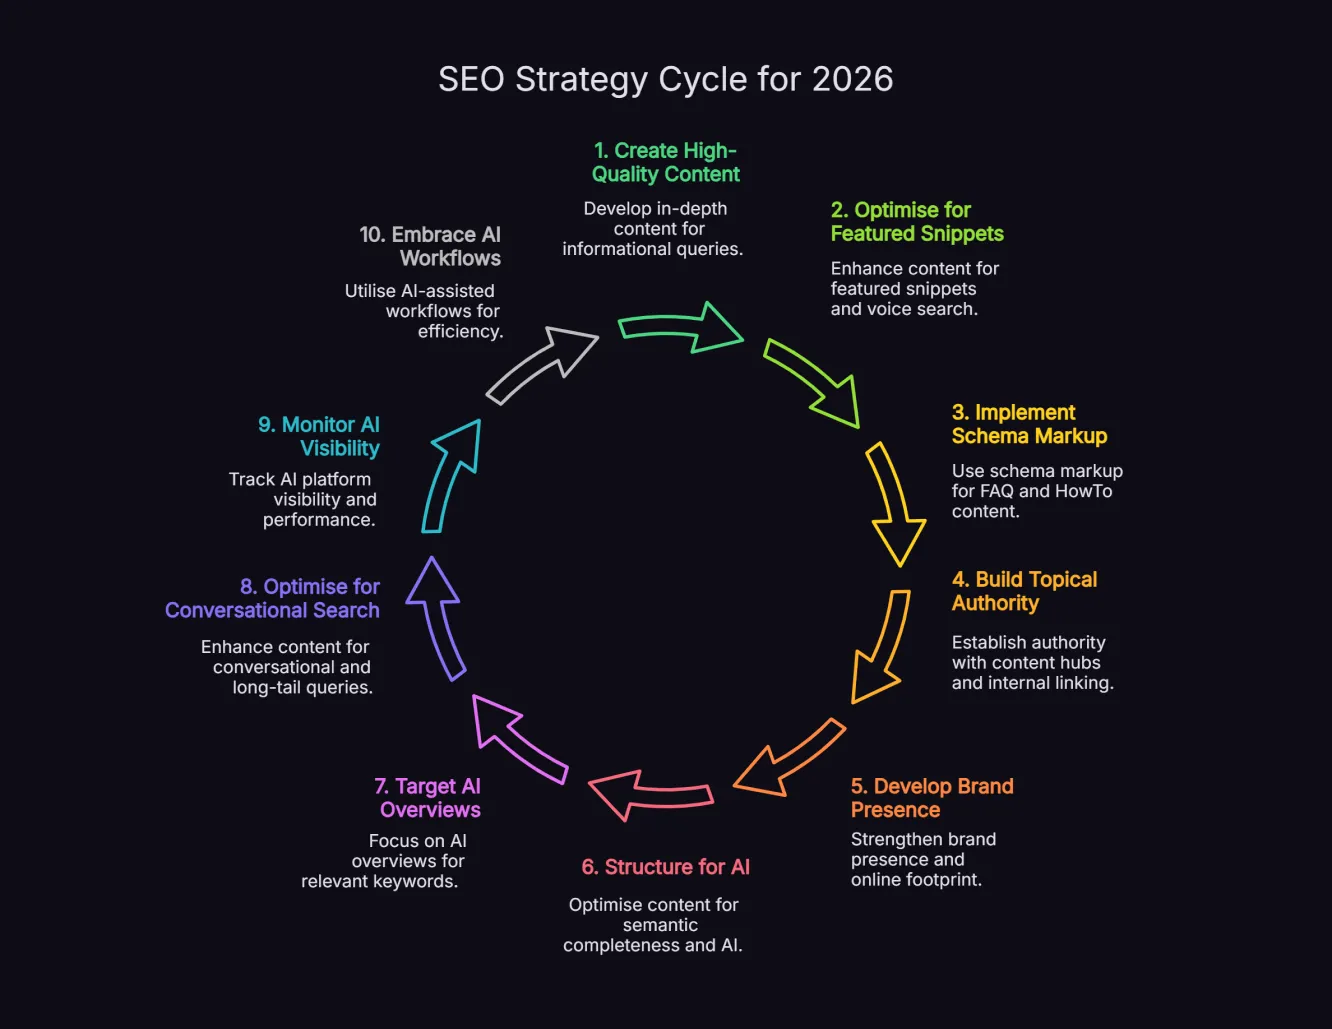
- Begin every engagement with a topical authority audit. Pages demonstrating expertise across a topic cluster receive ranking advantages, and 76% of AI Overview citations come from pages already in Google's top 10. Building topical authority is the single most leveraged input.
- Optimise for AI Overview citation, not just for ranking #1 below it. AI Overviews reduce organic clicks by 34.5%. Being cited inside the AI Overview captures attention that ranking 1-3 below it does not.
- Target AI platforms separately from Google. 80% of AI-cited sources do not appear in Google's top 10. Our B2B engagement earned 23 citations across ChatGPT, Gemini and Perplexity that were independent of Google ranking.
- Stop budgeting for outreach link building. In three of four recent engagements we earned 56% to 347% referring domain growth without spending on outreach. If your content does not earn links naturally, fix the content, not the link budget.
- Treat blog content as a conversion channel, not just an awareness channel. On the B2C engagement, 90%+ of conversions came from blog content rather than service pages. Most professional services firms still assume blogs do not convert. They do.
- Publish for full-cluster topical coverage, not just commercial keywords. Our SaaS engagement mapped 2,300+ keywords into clusters before publishing. The cluster approach prevented cannibalisation while feeding 1,126% click growth.
- Add AI-search measurement to your reporting. AI traffic is roughly 0.1% of web traffic but worth 4.4x more per visit. Measuring AI conversion separately from organic conversion is now table stakes.
- Restructure pages for passage-level extraction. AI platforms cite passages, not pages. Section-level structure (FAQ schema, TL;DR summaries, clear sub-headings) is what turns a ranking page into a citation-worthy one.
- Target high-intent specific queries, not generic head terms. On the B2C engagement, terms like "PTSD compensation claims" and "permanent impairment claims" outperformed generic "compensation claims" despite lower volume. Specificity beats volume on commercial intent.
Methodology and Data Freshness
To make this report verifiable, here is what is in each cluster of stats and the as-of dates.
First-Party Rankmax Data
Sourced from four detailed case studies published on rankmax.com.au and the AI Overview vs AI Mode SEO article that aggregates portfolio outcomes. All revenue, ROI, citation, traffic, click and conversion figures are linked back to the underlying case study. Engagement windows are disclosed inline (April 2024 to August 2025 for B2B services, October 2024 to August 2025 for B2C, January 2025 to August 2025 for eCommerce, 12-month rolling window for SaaS). The aggregate $26M+ figure reflects portfolio-level attributed revenue across these and other AI SEO engagements over a multi-year window, not a single year's revenue.
External Industry Data
Vetted to 2024-2025 sources. Older Backlinko, Ahrefs and Semrush studies that dated back to 2017-2020 (the 1,447-word page-one length figure, the 72.9% three-years-or-older pages figure, the 36.4% schema voice figure, the 29% three-word keyword figure, the 60% voice from snippets figure, the 9th-grade reading level figure, the 66% no-backlinks figure) have been removed where current replacements were not available. CTR figures are Backlinko 2023 (acceptable but ageing). Market share figures are StatCounter 2025. AI Overview, ChatGPT, AI traffic and AI content stats are predominantly 2024-2025 from Ahrefs, Semrush, Search Engine Land, OpenAI, Adobe, Originality.AI and Graphite.
How We Tested These Numbers Against Client Engagements
For the AI conversion quality stats specifically, we tested the industry-published figures (4.4x value per visit, 23x conversion rate for Ahrefs) against the conversion data from our own B2B services, B2C legal services, eCommerce and B2B SaaS engagements before including them. Two of four cases supported the directional finding that AI traffic converts well above its volume share. One sat at parity. None contradicted the direction. The 23x figure is the upper bound and reflects Ahrefs' developer-heavy audience profile. The 1.9x ratio we observed on the B2B engagement (AI 6.24% versus organic 3.29%) is closer to what most service businesses should expect.
Frequently Asked Questions
Why does this report use 80% first-party data rather than relying on industry sources?
Because the industry sources do not yet capture what is actually happening on operator-led AI SEO engagements in 2026. Most published AI search statistics are extrapolated from large public sample sets that mix high-performing and low-performing sites without filtering. That produces averages that do not match what an engaged client will see when running an actual AI SEO program. Our case-study numbers are the operator-side benchmark and they consistently sit between 2x and 50x the industry averages on metrics like ROI and AI citation growth. Combining both gives you a realistic upper bound and a realistic baseline.
What percentage of Google searches trigger an AI Overview in 2026?
Around 13.14% of Google searches now trigger an AI Overview, reaching roughly 2 billion monthly users. AI Overviews appear most often on informational queries in science, health and society categories. They reduce organic clicks by approximately 34.5% on the searches they appear on, and only about 19% of users click through to a cited source.
How much of an SEO budget should go to AI search optimisation versus traditional SEO?
In our recent engagements, AI search optimisation has not been a separate budget line. The same content and authority work that builds Google rankings produces AI citations downstream, because 76% of AI Overview citations come from pages already ranking in Google's top 10. The exception is non-Google AI platforms (ChatGPT, Perplexity, Gemini), where 80% of cited sources do not appear in Google, and where standalone work to earn citations does pay off independently. We allocate roughly 80% of program effort to integrated Google-plus-AI-Overview content, and roughly 20% to platform-specific citation work for ChatGPT, Perplexity and Gemini.
Use This Report as a Benchmark, Not a Conclusion
The numbers in this report are a snapshot of what we are seeing across our engagements and what the industry is reporting in 2026. They are not a guarantee of what your business will see. The unifying mechanism behind the Rankmax-observed figures is that we run ongoing 12-to-17-month engagements, build topical authority before chasing head terms, treat AI citation as a separate workstream from Google ranking and report against revenue rather than rankings. If those four conditions hold for your engagement, the directional pattern should hold too. If any one of them is missing, you should expect to land closer to the published industry averages.
About the Author
Want Insights Like This Fortnightly?

Our AI SEO strategies and tactics delivered fortnightly, including bonus trade secrets not shared anywhere else. No fluff. Just what's working right now. 5-minute read.


