
180+ Content Marketing Statistics for 2026: The Data and What It Means


Your competitors are investing more in content. AI is reshaping how content gets created and discovered. And the ranking rules for both Google and AI search platforms keep shifting under your feet. If you are building a content marketing strategy for 2026, you need data to guide your decisions, not guesswork. Every content marketing statistic in this guide comes from a named source and is tagged with the year it was published.
A Quick Guide to Content Marketing Statistics
A content marketing statistic measures the performance, adoption, investment and outcomes of content-driven marketing across channels like blogging, video, social media and email. Around 90% of businesses use content marketing, and companies that prioritise blogging are 13x more likely to see positive ROI. The industry is valued at about $525 billion in 2025 and is projected to reach about $990 billion by 2030. The numbers below tell you what works. The harder question, which most stat roundups skip, is what you should do about it.
Want Content That Moves Revenue, Not Just Traffic?
We build AI-ready content campaigns for mid-market and growth brands that need organic search and AI citations tied to revenue. The same methodology sits behind more than $26M in attributed client results across our case studies. See how Rankmax content marketing works when strategy, production and measurement run as one system.
Explore Content Marketing ServicesGeneral Content Marketing Statistics
These foundational statistics reveal how businesses adopt, invest in and measure content marketing success.
- Over 90% of businesses use content marketing: Demand Metric (2019)
- The content marketing industry is valued at about $525 billion in 2025, projected to about $990 billion by 2030: Mordor Intelligence (2025)
- Content marketing generates 3x the leads of outbound marketing and costs 62% less: Demand Metric (2019)
- 70% of marketers say they can demonstrate how content marketing has grown leads and engagement: Marketful (2023)
- Content marketing leaders see 7.8x more site traffic than non-leaders: IAB SA (2021)
- 29% of marketers actively build content marketing into their strategy: HubSpot (2024)
- 50% of marketers plan to increase their content marketing investment: HubSpot (2024)
- 83% of marketers believe it is more effective to create higher-quality content less often: HubSpot (2022)
- 79% of companies graded "very successful" spend more than 10% of their marketing budget on content alone: MarketingProfs (2023)
- 80% of very successful companies have a documented content marketing strategy: MarketingProfs (2023)
- 35% of B2B marketers say they measure content marketing ROI: Marketful (2023)
- 71% of brands spend under $1,000 per month on content marketing: Semrush (2024)
Our take: The industry gap between serious content budgets and the under-$1,000 majority is real, but Rankmax clients are not trying to win on a hobby budget. What we see across mid-market and enterprise campaigns is simpler: fewer topics, funded properly, measured to revenue. That is how we stack content against case study outcomes rather than vanity publish volume.
SEO and Organic Search Statistics
Organic search is still the primary traffic driver for most websites. These statistics show how content marketing intersects with SEO performance.
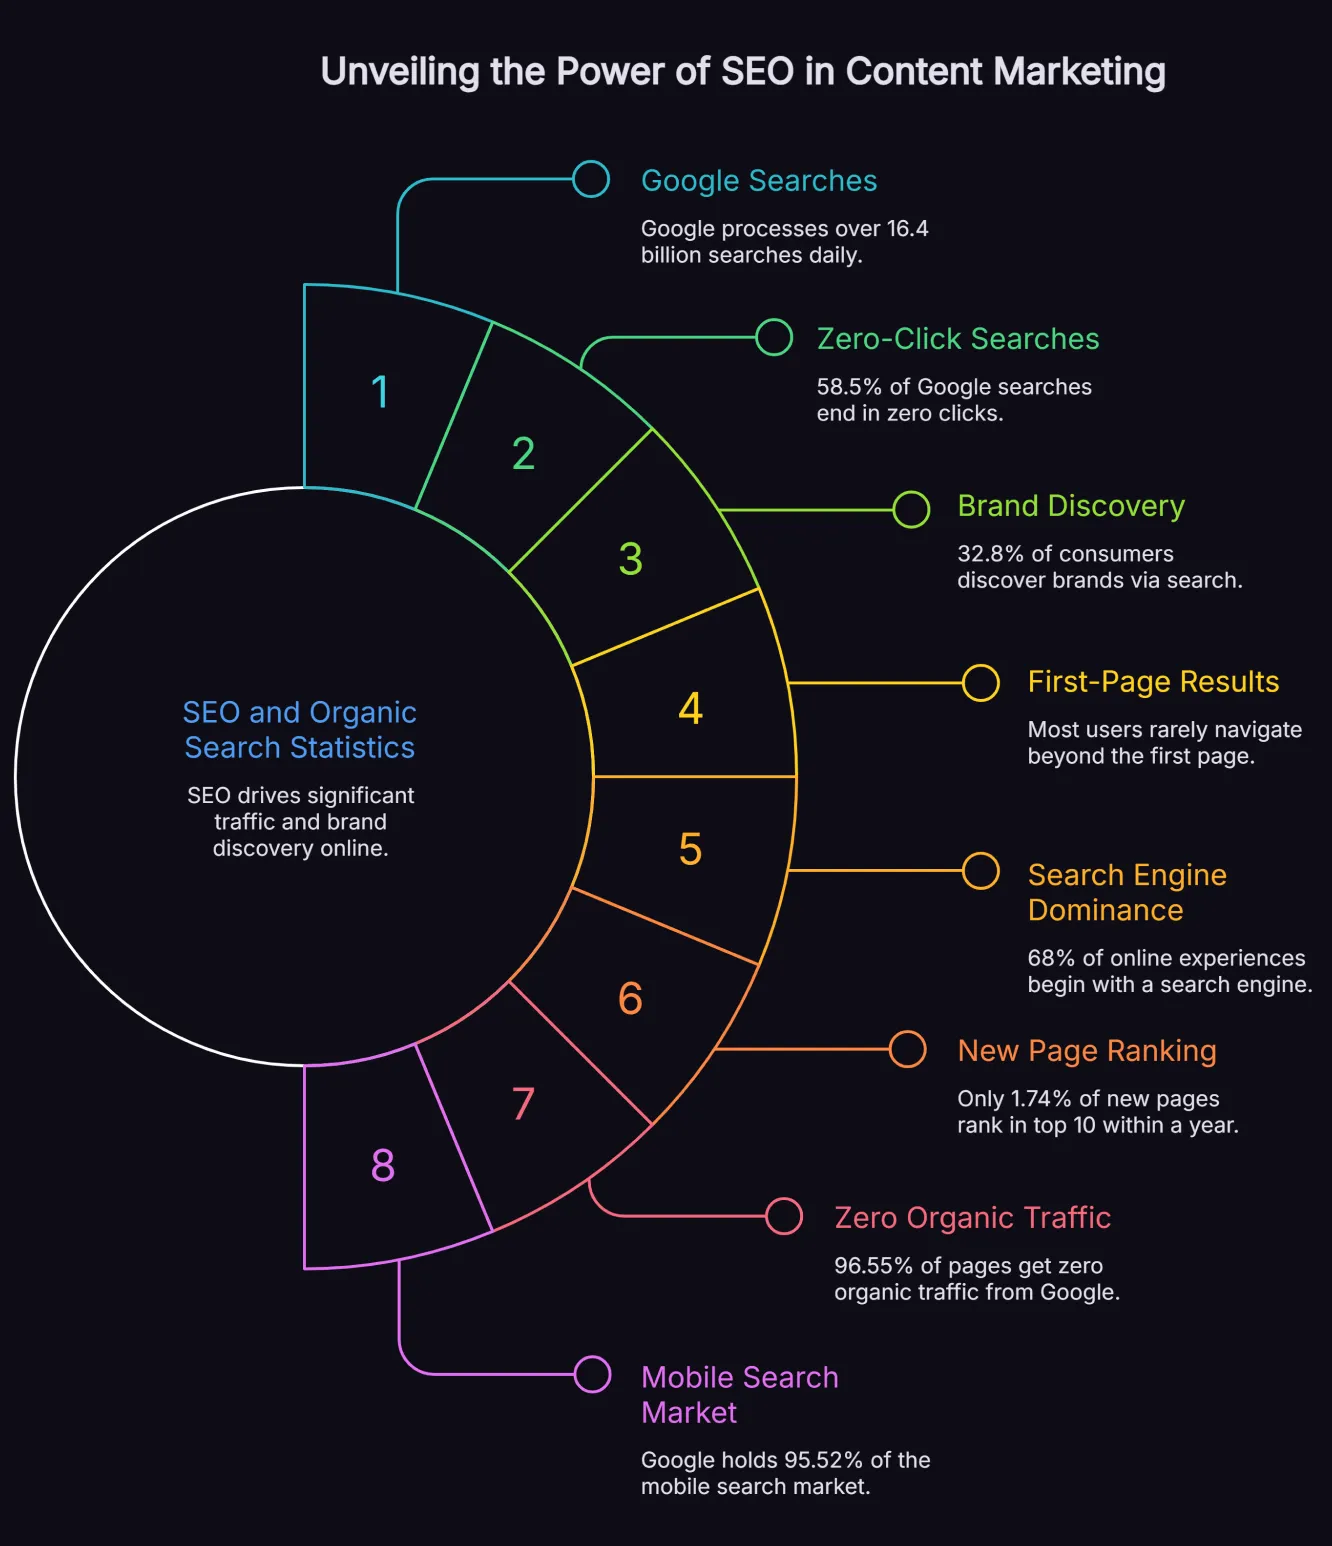
- Google processes over 16.4 billion searches daily: Exploding Topics (2025)
- 58.5% of Google searches now end in zero clicks: SparkToro (2024)
- 32.8% of consumers discover new brands via internet search: DataReportal (2025)
- Most users rarely navigate beyond the first page of results: HubSpot (long-standing benchmark, treat as directional)
- 68% of online experiences begin with a search engine: BrightEdge (2019, dated)
- Only 1.74% of new pages rank in the top 10 within a year: Ahrefs (2023)
- 96.55% of pages get zero organic traffic from Google: Ahrefs (2023)
- Google holds 95.52% of the mobile search market: StatCounter (2026)
- SEO generates over 1,000% more traffic than organic social media: Search Engine Land (2021)
- The top three Google results capture 54.4% of all clicks: Backlinko (2023)
- 41% of larger companies view link building as the hardest part of SEO: Inbound (2022)
- "Near me" searches have surged by 500%: Think with Google (2018, dated)
- 72.9% of pages in Google's top 10 are over three years old: Ahrefs (2023)
- Local search queries lead to 1.5 billion location visits each month: Think with Google (dated)
- 45.7% of Google searches are branded: Ahrefs (2024)
- Google sends 345x more traffic than ChatGPT, Gemini and Perplexity combined: Ahrefs (2025)
- AI Overviews appear on 21% of keywords: Ahrefs (2025)
Our take: Zero-click search and AI Overviews make thin page-four content increasingly invisible. Depth on fewer pages is not a blog tip for us. It is how we rebuild sites. On one eCommerce engagement, a technical and content rebuild drove 91% organic revenue growth over eight months, with 126 Google AI Overview citations and 12 ChatGPT citations following once the pages were strong enough to rank and get cited. The same campaign later reached about $1.75M attributed over 16 months. Full method in our Core Web Vitals guide.
AI in Content Marketing Statistics
Artificial intelligence has changed how content gets created, optimised and discovered. These statistics show AI's growing influence on content marketing.
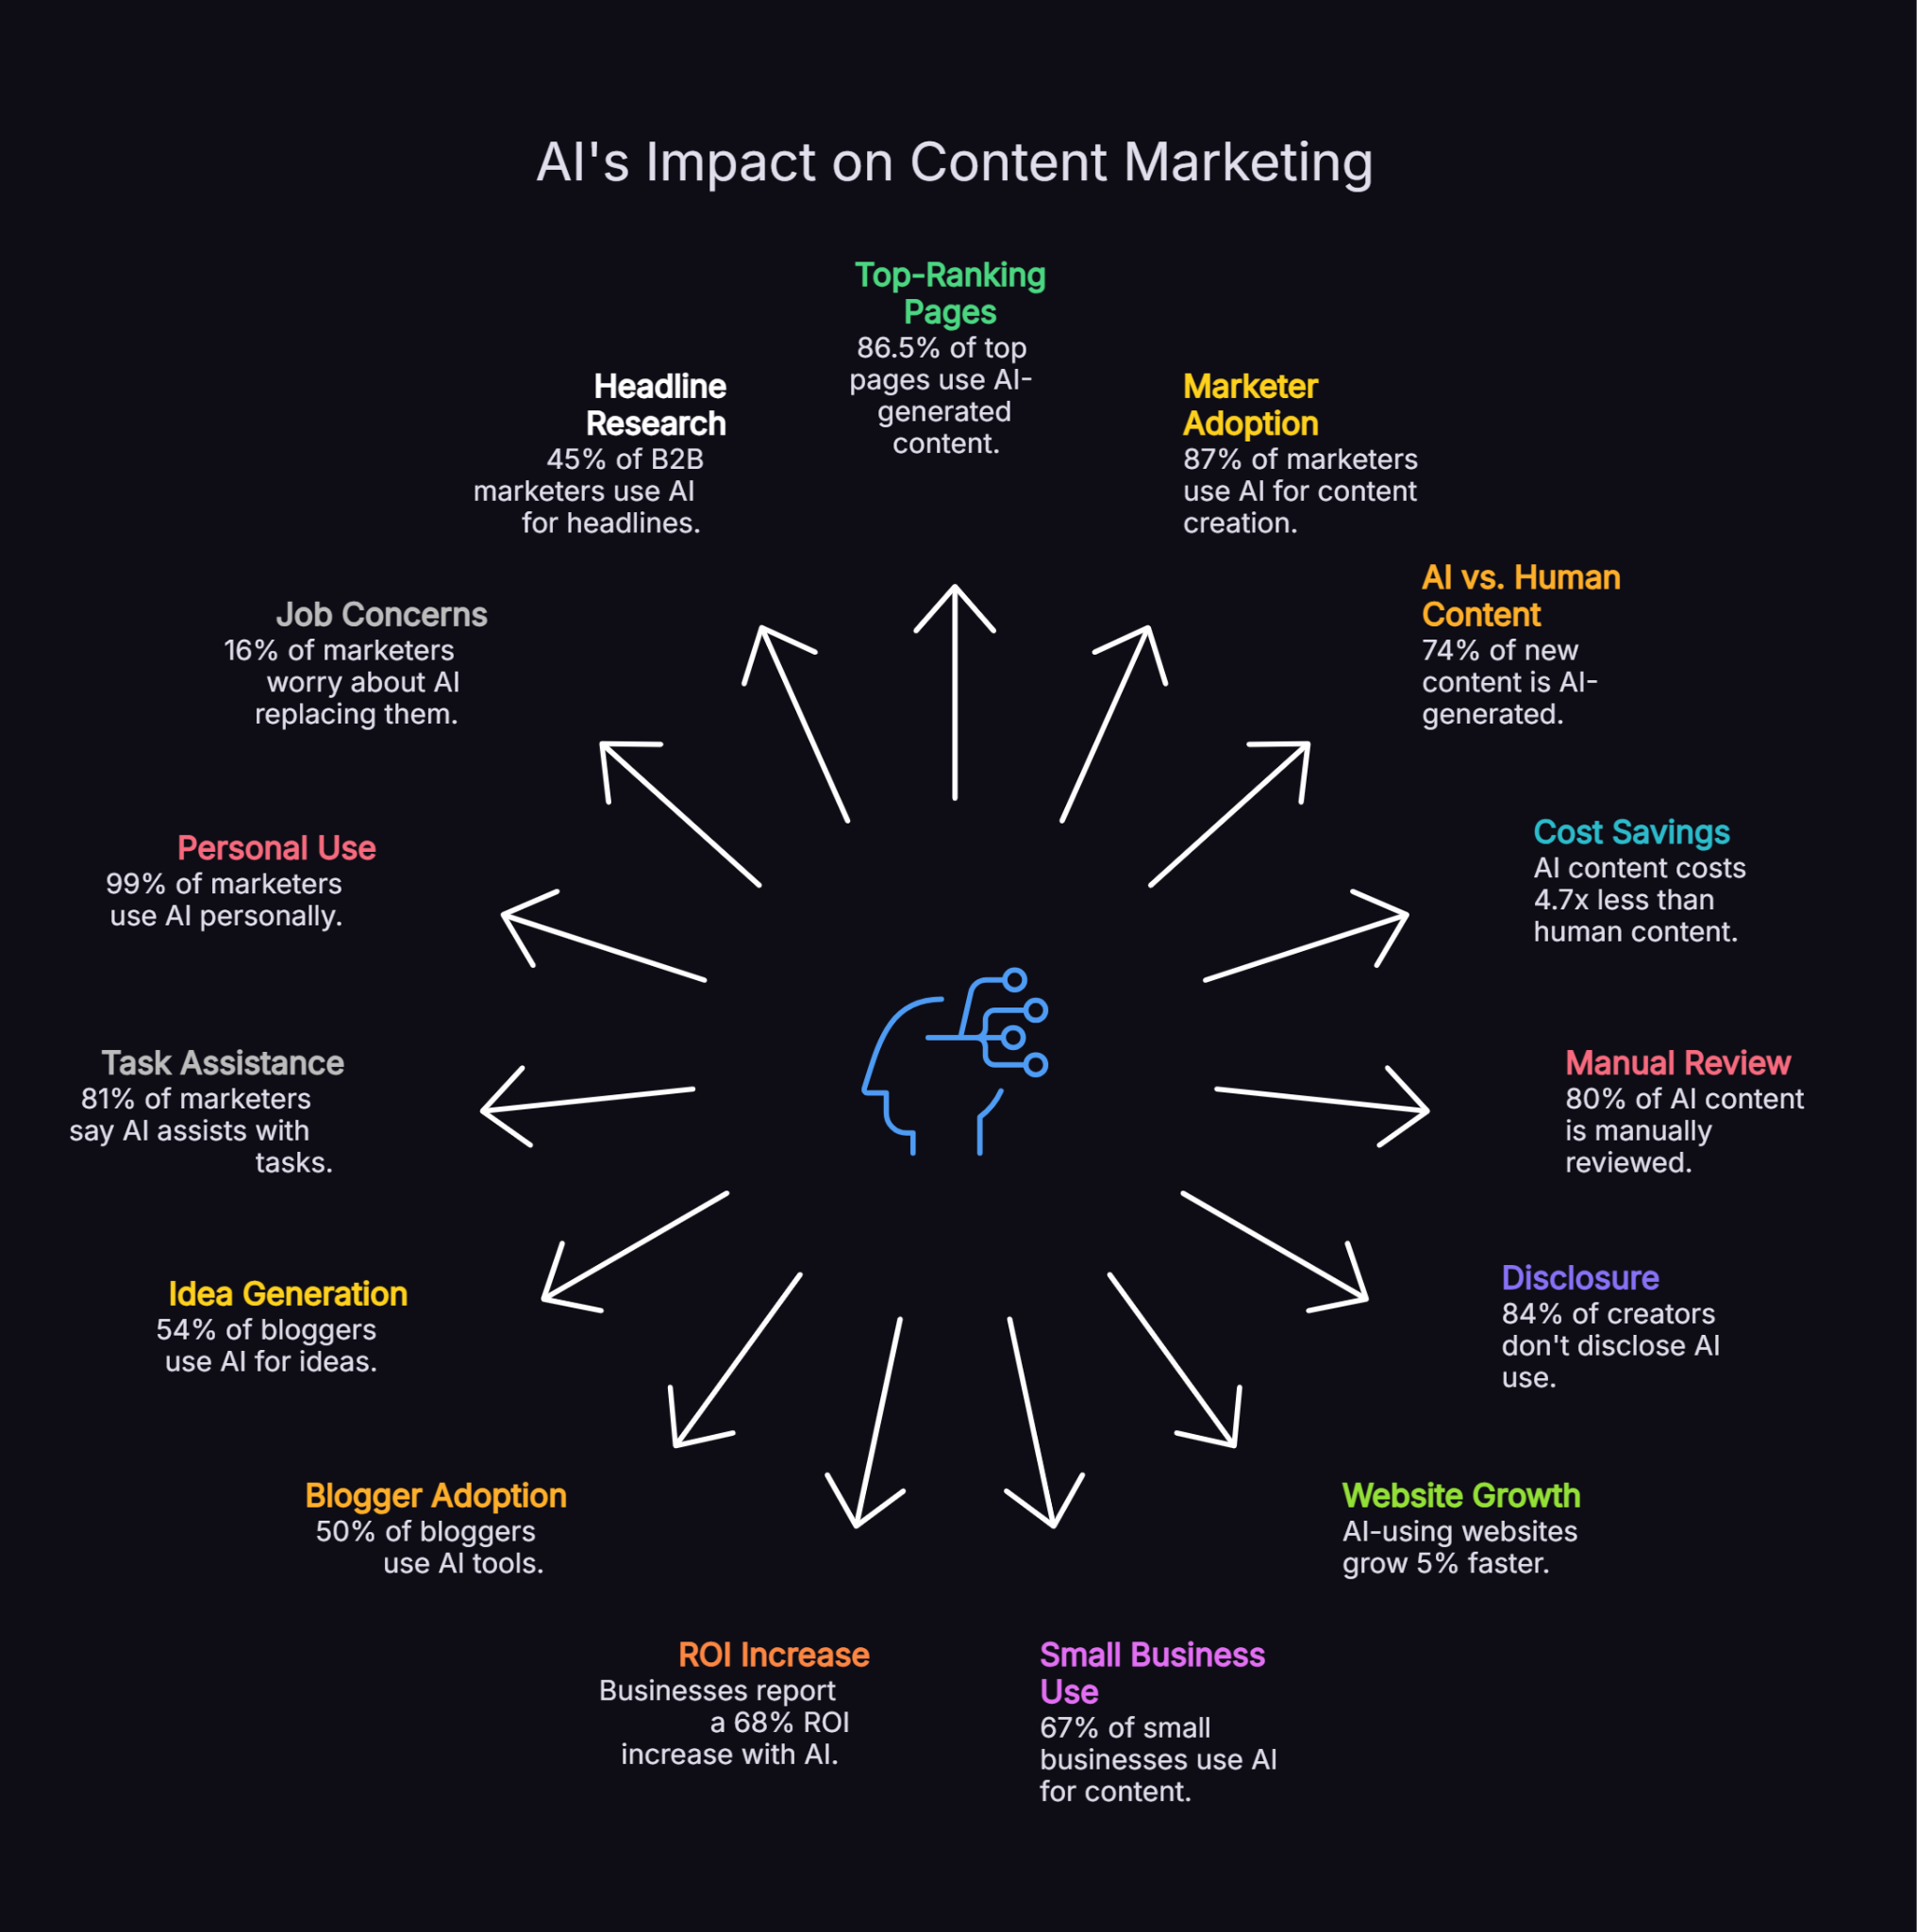
- 86.5% of top-ranking pages contain AI-generated content: Ahrefs (2025)
- 87% of marketers use AI to support content creation: Ahrefs (2025)
- 74% of new web content is created with AI; only 26% is purely human: Ahrefs (2025)
- AI content costs 4.7x less than human-written content: Ahrefs (2025)
- 80% of marketers who use AI manually review it before publishing: Ahrefs (2025)
- 84% of content creators do not disclose their use of AI: Ahrefs (2025)
- Websites using AI grow 5% faster than those that do not: Ahrefs (2025)
- 67% of small business owners and marketers use AI for content marketing or SEO: Semrush (2024)
- Businesses using AI report an average 68% increase in ROI: Semrush (2024)
- 50% of bloggers now use AI tools in their content creation: Scoop.it (2025)
- 54% of bloggers use AI to generate content ideas: Orbit Media (2024)
- 81% of marketers say generative AI assists with various marketing tasks: HubSpot (2024)
- 99% of marketers personally use AI in some form: Marketing AI Institute (2025)
- 16% of marketers worry about AI replacing their roles: HubSpot (2024)
- 45% of B2B marketers using generative AI use it to research headlines and keywords: CMI (2024)
- 53.5% of commercial-intent ChatGPT queries triggered live search: LinkedIn (2026)
Our take: Adobe’s tenfold AI-referral growth and Kevin Indig’s finding that 44.2% of ChatGPT citations come from the first 30% of a page match what we measure on client accounts. AI traffic is still a smaller share than Google organic, but it converts harder when it arrives. On a B2B campaign, AI search traffic converted at 6.24% against 3.29% for traditional organic. We structure pages so the answer is up front, then expand, which is the same pattern we use in our Search Intent guide.
Blogging Statistics
Despite predictions of its decline, blogging is still one of the most effective formats for organic traffic and lead generation.
- Blog posts remain the most popular format, used by 90% of marketers: NY Times Licensing (2023)
- Marketers who prioritise blogging are 13x more likely to see positive ROI: HubSpot (benchmark, treat as directional)
- Companies that blog have 434% more indexed pages than those that do not: HubSpot (dated benchmark)
- 53% of marketers say blog content is a top inbound priority: HubSpot (2017, dated)
- Articles with 7+ images get 555% more backlinks and 259% more page views than those with none: Semrush (2023)
- Only 27% of people read blog posts thoroughly; 73% admit to skimming: HubSpot (2022)
- Around 7.5 million blog posts are published every day: BlogMaker (2024)
- Only 3% of brands regularly publish posts longer than 2,000 words: Orbit Media (2024)
- Blog posts with at least one video attract 70% more organic traffic: Semrush (2023)
- "Everything you need to know" and comparison content drive the most organic traffic, yet only 0.4% and 0.8% of articles use these formats: LinkedIn (2023)
- 23.84% of high-performing blogs are published daily: LinkedIn (2023)
- Only 16.73% of high-performing blogs were difficult to read, while 33.45% were easy: Semrush (2023)
- 5% of high-performing articles contain original data studies, vs 2% of low-performing ones: Marketing Insider Group (2023)
- 60% say their blog delivers some results and 21% say it delivers strong results: Orbit Media (2024)
- 76% of bloggers publish educational content: Orbit Media (2024)
Our take: Comprehensive, original-data content is still rare, which is why it works. We do not publish daily for clients. We publish fewer pieces that carry a number or outcome nobody else has. That is the pattern behind the B2B content that earned 138 AI citations in a climb window and later supported about $8.7M attributed over 27 months. Original results beat recycled advice every time.
Video Marketing Statistics
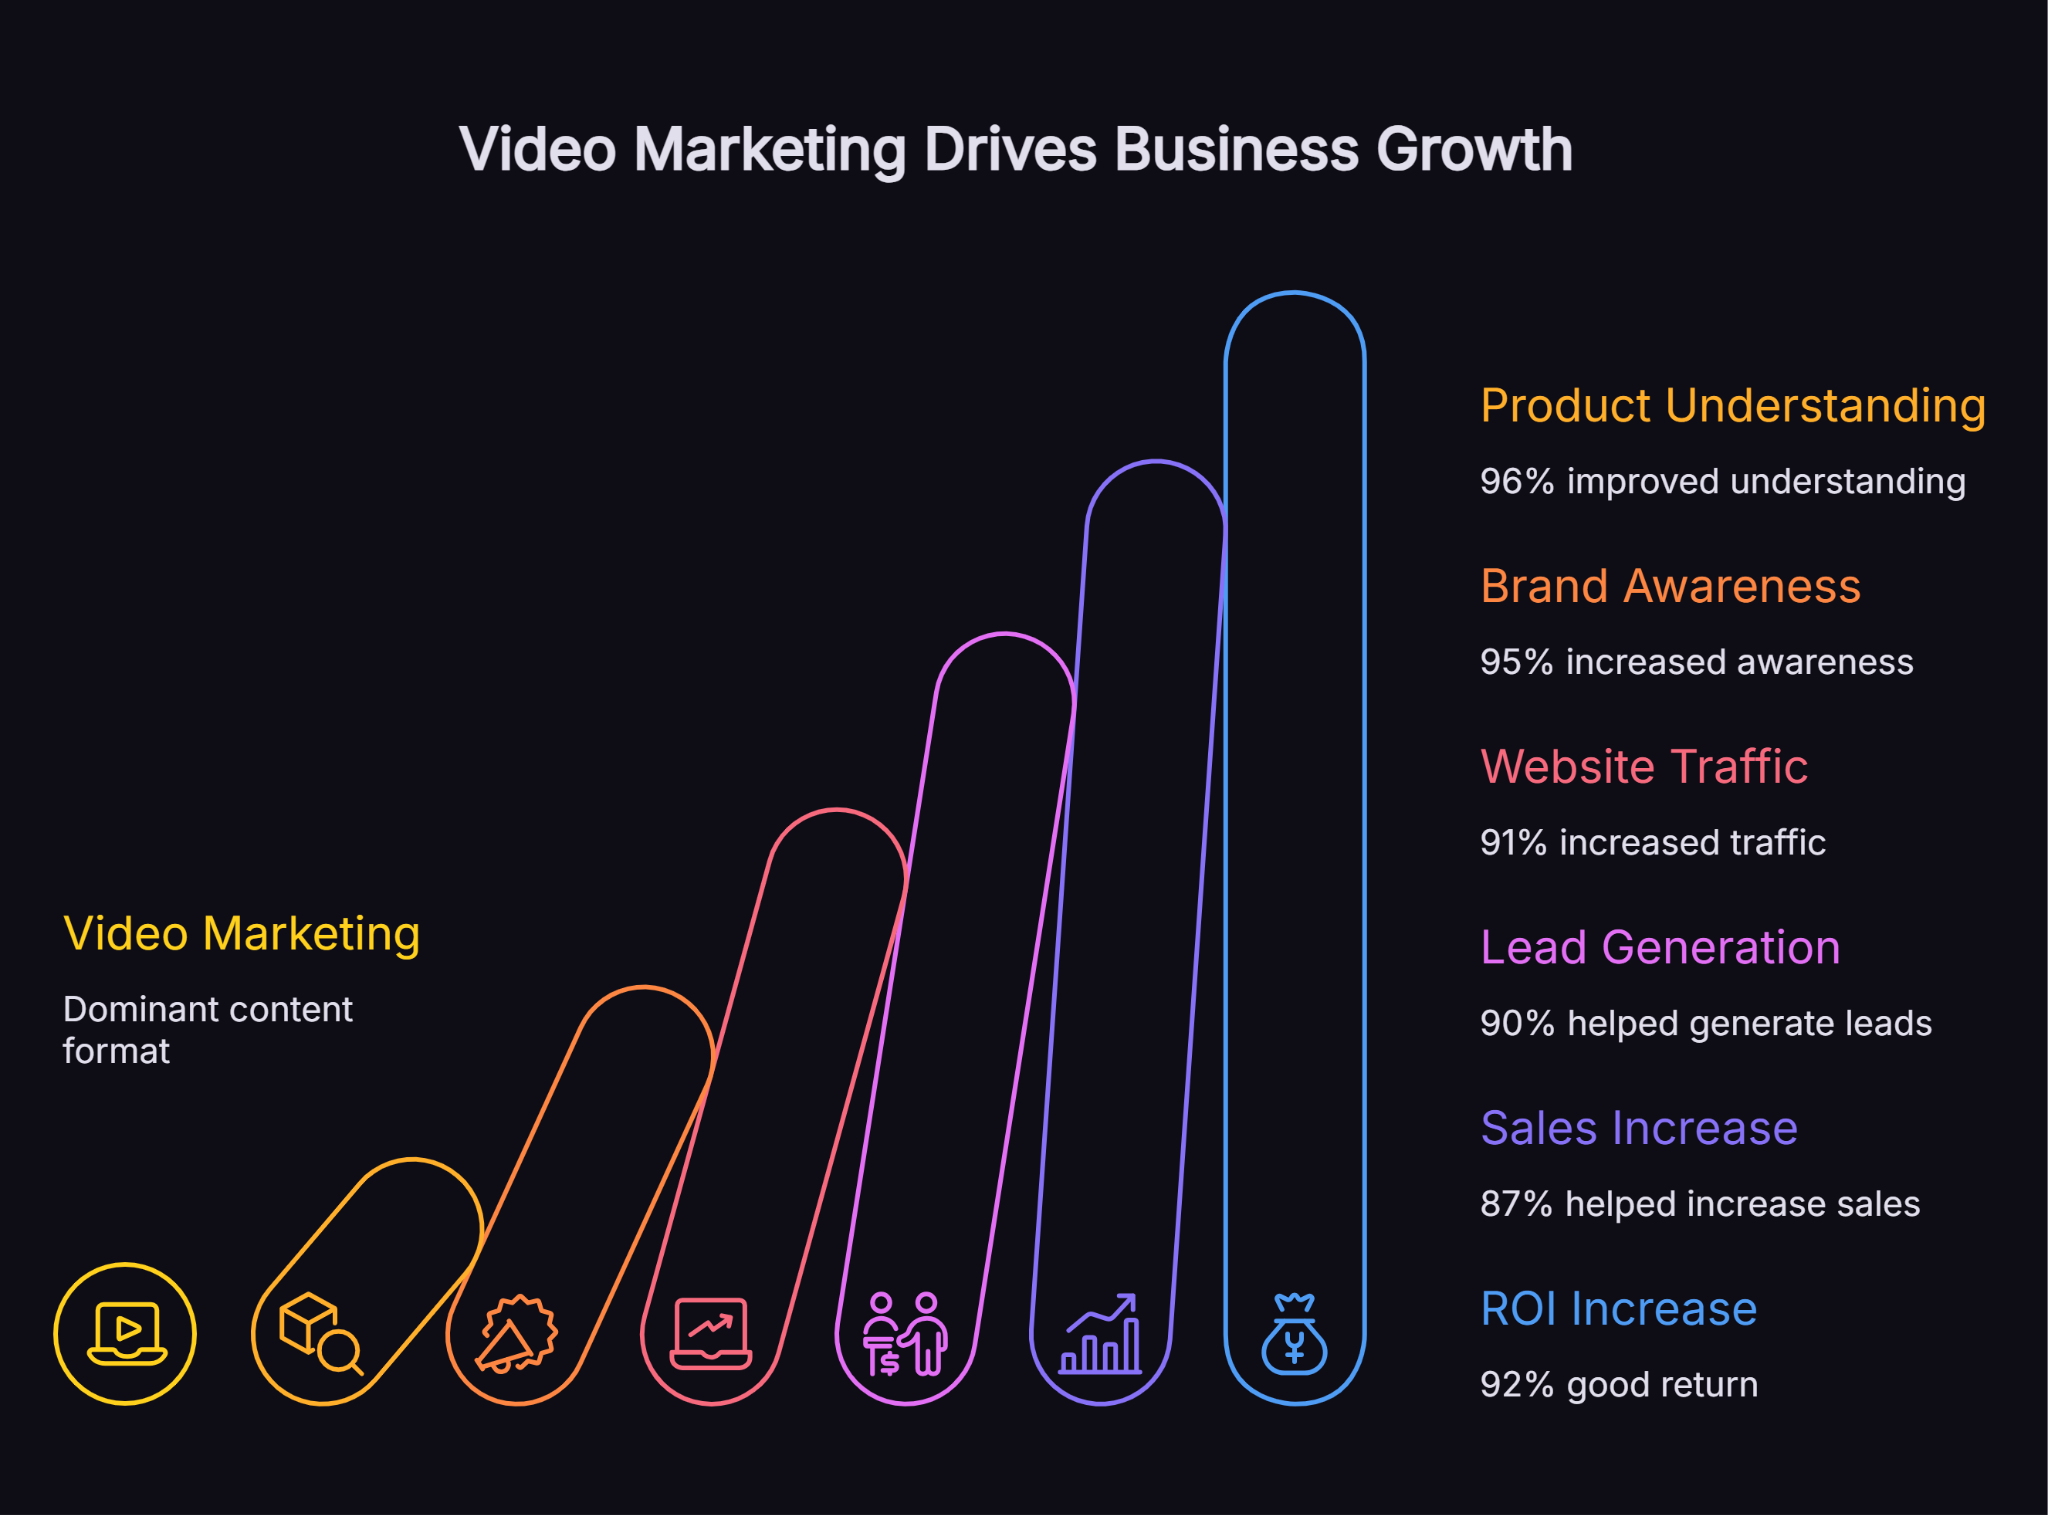
Video is now the dominant content format, with adoption and ROI at all-time highs.
- 91% of businesses use video as a marketing tool, an all-time high: Backlinko (2024)
- 96% of video marketers say video improved users' understanding of their product: Wyzowl (2023)
- 95% say video has increased brand awareness: Wyzowl (2023)
- 91% say video has increased website traffic: Wyzowl (2023)
- 90% say video has helped generate leads: Wyzowl (2023)
- 87% say video has helped increase sales: Wyzowl (2023)
- 92% say video gives them a good return on investment: Wyzowl (2023)
- 79% of marketers were convinced to buy software or an app by watching a video: Wyzowl (2023)
- 73% of consumers prefer short-form video to learn about products: The Leap (2024)
- Short-form videos up to 90 seconds hold a 50% retention rate: Innovation Visual (2023)
- TikTok videos over one minute get 63.8% more watch time than 30-60 second clips: Buffer (2023)
- 21% of marketers report short-form video has the highest ROI of any format: TS2 (2025)
- 30% of marketers who do short-form video started since 2024: BlueSky Education (2024)
- YouTube is the most popular video platform, used by 90% of marketers: Wyzowl (2023)
- YouTube has 2.58 billion users: Exploding Topics (2025)
- 70% of people bought from a brand after seeing it on YouTube: Google (2023)
- 84% of B2B marketers use video in their strategy: CMI (2024)
Our take: Video is a multiplier on pages that already earn intent, not a separate empire to staff from scratch. Where we add a clear explainer or product video to high-intent SEO pages, dwell and engagement usually improve without needing a full YouTube campaign. Treat video as support for the search asset, not a second strategy.
Social Media Statistics
Social media is still a critical distribution channel, though engagement and platform preferences keep shifting.
- Average time on social media is 2 hours 21 minutes per day globally: Exploding Topics (2025)
- Facebook is still the most used platform by marketers: Sprout Social (2024)
- Instagram has 3 billion monthly users: Business.com (2026)
- TikTok has 1.99 billion users: Exploding Topics (2025)
- TikTok is the most downloaded non-gaming app, with 825 million downloads: Priori Data (2024)
- 93% of marketers globally use social media for business: Adobe Express (2024)
- TikTok is the most popular influencer marketing platform, used by 55.5% of brands: Content Science Review (2024)
- Instagram engagement rate averages 0.36%: Rival IQ (2024)
- Facebook engagement rate averages 0.046%: Rival IQ (2024)
- X (Twitter) engagement rate averages 0.015%: Rival IQ (2025)
- Posts with a question get 100% more comments: Simple Marketing Now (dated)
- Instagram posts with a location get 79% more engagement: HubSpot (2020, dated)
- Best days to post: Tuesday and Wednesday: Sprout Social (2026)
- B2C content gets 9.7x more shares than B2B: Backlinko (2023)
- 85% of marketers say LinkedIn is best for B2B: Elfsight (2024)
- 2.35 billion people interact with Instagram Reels each month: OkZest (2024)
- Instagram Reels average a 1.95% engagement rate: Marketing Charts (2024)
Our take: Sub-0.5% social engagement rates match what we tell mid-market B2B clients: organic social amplifies search and AI-visible content; it does not replace it. We use LinkedIn and author profiles to reinforce E-E-A-T around the pages that already rank and get cited, not as the primary demand engine.
Podcast and Audio Statistics
Audio keeps growing as a content channel, with podcasts now at mainstream adoption.
- 70% of Americans have listened to a podcast: Edison Research (2025)
- 68% of podcast listeners are open to ads: Edison Research (2025)
- 44% of podcast listeners have bought something from a podcast ad: Edison Research (2025)
- Around 652 million podcast listeners are projected worldwide by 2027: Beamly (2024)
- 25% of marketers use podcasts or other audio in their strategy: HubSpot (2024)
- Only 3% of content marketers leverage podcasts: Semrush (2023)
- Podcast ad spending in the US reached $2.55 billion: Digital Content Next (2025)
Our take: Podcasts are still underused relative to spend in the category, but they are rarely the first move for the clients we take on. We only push audio when buyers already listen in that market. Until then, long-form search assets and case-study proof usually return faster.
Email Marketing Statistics
Email is still one of the highest-ROI channels for content distribution and lead nurturing.
- Average email click-through rate is 1.36%: Constant Contact (2024)
- Segmented emails drive 30% more opens and 50% more clicks: Intentsify (2023)
- 95% of marketers rate AI for email creation as effective: Ahrefs (2025)
- 61-70 character subject lines have the highest open rates: Superhuman (2024)
- Videos in emails lift open rates by 4-12 points and CTR by 0.97-2.04 points: Ahrefs (2024)
- 71% of B2B marketers use email newsletters in their content strategy: CMI (2025)
- 71% of consumers expect personalised interactions from brands: McKinsey (2021)
- 76% get frustrated when brand interactions are not personalised: McKinsey (2021)
- 80% of consumers are more likely to buy from a company that personalises: Epsilon (2018, dated)
- 59% of consumers say marketing emails influence their purchases: OneIMS (2023)
- Over 50% buy from an email at least once a month: Ayokay (2023)
- B2B email open rate is 15.14% vs B2C at 19.7%: Intero Digital (2024)
- B2B click rate is 3.18% vs B2C at 2.09%: Mailmodo (2024)
- Email conversion rate is 2.8% for B2C and 2.4% for B2B: First Page Sage (2024)
Our take: As zero-click and AI answers cut easy organic clicks, owned email becomes more valuable, not less. In our campaigns, the best-performing SEO and AI content is what grows the list. Content earns the subscriber; email keeps the relationship when rankings or AI citations shift.
B2B Content Marketing Statistics
B2B marketers face distinct challenges and opportunities in content strategy and execution.
- 94% of B2B marketers create short articles and blog posts: CMI (2024)
- 78% of B2B marketers use case studies and customer stories: CMI (2024)
- 66% of B2B marketers put audience needs over sales goals when creating content: Redev (2023)
- 93% of B2B content gets zero backlinks: Backlinko (2023)
- Top ROI channels for B2B: website, blog and SEO, paid social, social shopping tools: HubSpot (2024)
- 86% of B2B marketers use paid content distribution: CMI and MarketingProfs (2024)
- 78% of B2B marketers who pay to promote content rely on social media ads: CMI (2024)
- 63% of marketers use paid channels to amplify content: Madison (2023)
- Attracting quality leads is the top content challenge for B2B brands: Semrush (2023)
Our take: Most B2B marketers say case studies work, yet most B2B content still earns no links because it says nothing new. Hard numbers change that. On our B2B property management engagement, content built on verifiable outcomes earned 138 AI citations over a 17-month climb window and now sits behind about $8.7M attributed over 27 months. If your case studies carry real results, they become your most linkable and most quotable assets.
B2C Content Marketing Statistics
B2C strategies differ from B2B, with their own channel preferences and ROI drivers.
- Top ROI channels for B2C: email marketing, paid social, content marketing: HubSpot (2024)
- B2C content marketing is the third most significant source of customer retention, at 32%: Vital (2023)
Our take: For B2C and eCommerce, content has to move conversion, not just traffic. We saw that directly on an eCommerce engagement: conversion rate rose from 6.97% to 9.73% year on year while monthly organic revenue moved from $77,000 to $147,000 in the early eight-month window, then continued to about $1.75M attributed over 16 months. Better content converted demand that was already there.
Conversion and ROI Statistics
These statistics show how content marketing affects business outcomes like leads, conversions and revenue.
- Average website bounce rate is 37%: HubSpot (2024)
- Average SEO click-through rate is 13%: HubSpot (2024)
- Average e-commerce conversion rate is under 1.4%: Statista (2026)
- 72% of businesses say content marketing boosts lead generation: WebFX (2023)
- 67% of marketers track revenue from content-driven leads and conversions: Semrush (2023)
- Two in three marketers report a landing page conversion rate under 10%: HubSpot (2024)
- 58% of B2B marketers credit content marketing with generating sales and revenue: CMI (2024)
- Businesses with content marketing have nearly 6x higher conversion rates: Redline Digital (2023)
- Blogging can generate 126% more leads: HubSpot (dated benchmark)
- Only 3% of marketers describe their content efforts as unsuccessful: Semrush (2023)
- 53% of marketers who update content notice increased engagement: Semrush (2023)
- 49% see ranking and traffic increases after updating content: Semrush (2023)
Our take: Industry “content multiplies conversion” stats only stick when the channel is right. In our work, AI-referred sessions often convert harder than classic organic. On one B2B account, AI search converted at 6.24% versus 3.29% organic. The quieter lever is maintenance: refreshing existing pages lifts engagement and rankings, which is why this article sits on a six-month refresh cycle rather than a publish-and-forget calendar.
Mobile Statistics
Mobile is now the primary way consumers access and engage with content.
- 63% of consumers prefer to research brands and products on mobile: HubSpot (2024)
- Smartphones account for over 77% of retail website visits: Semrush (2024)
- E-commerce is over 20.1% of all global retail sales: Oberlo (2024)
- 52.27% of global website traffic comes from smartphones: Statista (2026)
- Around 89% of mobile users check their phone within the first hour of waking: Deloitte (2024)
Our take: With most traffic on mobile, page experience is a revenue job. Slow pages lose users and rarely earn AI citations. On the eCommerce campaign above, Core Web Vitals work was a prerequisite for the citation lift, not a side project. Full method in our Core Web Vitals audit guide and Technical SEO guide.
Voice Search Statistics
Voice search adoption keeps growing, creating new opportunities and challenges.
- 20.5% of the global population used voice search: DemandSage (2026)
- 34% of Americans own a smart speaker: Edison Research (2024)
- 13% of marketers use voice search optimisation: HubSpot (2024)
Our take: Voice and AI search reward the same craft: a clear answer early. We do not run a separate “voice SEO” workstream. We structure pages so the first screen answers the query, then expand. That matches Kevin Indig’s 44.2% first-30% citation finding and is standard on Rankmax content briefs.
Content Marketing Career Statistics
For people working in content marketing, these statistics reveal salary trends and job satisfaction factors.
- Average content marketer salary is $111,891: Superpath (2024)
- 13% of content marketers were laid off: Superpath (2024)
- 49.24% of content marketers are satisfied with their salary: Ahrefs (2024)
- Quality of work and creative freedom matter most for job satisfaction: The Content Studio (2024)
- Writing (29%), analytics (25%) and video (18%) are the top skills for senior content marketers in the US: Market.biz (2024)
Our take: The modern content hire is supposed to write, analyse and ship video. Most mid-market teams cannot staff all three well. That is why specialist partners exist. What clients hire us for is not more activity. It is the analytics discipline that ties content and technical work back to revenue, the same way we report on case studies.
Emerging Trends and Future Statistics
These statistics point to where content marketing is heading in 2026 and beyond.
- Gen Z targeting is up 36%, while Gen X targeting is down 41%: HubSpot (2024)
- In 2026, blogging is re-emerging as a leading format marketers are adopting for the first time: OptinMonster (2025)
- 62% of marketers plan to add interactive content: WebFX (2024)
- Algorithm changes are now the #1 challenge for content marketers, at 22.2%: Adam Connell (2024)
- Over two-thirds of SEO professionals say SERP competition is increasing: Adam Connell (2024)
- 36.3% of SEO professionals believe AI-powered search will be the biggest disruptor: Adam Connell (2024)
- 70% of people prefer information from blogs over traditional advertising: Marketveep (2023)
- The most popular formats are how-to articles (76%) and lists (55%): Statista (2024)
Our take: Algorithm panic and AI panic are the same fear twice. Chasing every update loses to topical authority built on proof. Adobe’s AI-referral growth is real, and so is the conversion lift we see when pages are citation-ready. The brands that win 2026 are structuring for Google and AI now, which is the spine of our AI SEO strategy work.
Consumer Behaviour and Trust Statistics
Understanding how consumers interact with and trust content is essential for effective marketing.
- 91% of consumers trust online reviews as much as personal recommendations: Podium (2024)
- 50% of consumers trust reviews as much as personal recommendations: BrightLocal (2024)
- 87% of consumers won't use a business rated under 3 stars: BrightLocal (2023)
- Consumers read an average of 10 online reviews before purchasing: BrightLocal (2019, dated)
- 96% of users actively seek out negative reviews: PowerReviews (2021)
- 44% of people consume 3-5 pieces of content before engaging a vendor: DemandGen (2023)
- 75% say data-backed content is more trustworthy than content without data: SurveyMonkey (2023)
Our take: Buyers read several pieces before they talk to you, and they trust data over opinion. That is why we lead with sourced numbers and first-hand outcomes in client content, not hot takes. Original, verifiable data is also what AI engines prefer when they choose whom to cite.
Content Performance Metrics
These statistics reveal how marketers measure success and what sets high-performing content apart.
- Web traffic is the top indicator marketers use to measure content success: CMI (dated)
- 20% of articles are high-performing, 60% average, 20% low-performing: Semrush (2023)
- Content length matters less than topic coverage; comprehensive content performs better: Semrush (2023)
- Fewer low-performing articles are under one month old; more sit in the 12-month-old group: Semrush (2023)
- Successful articles use original research, varied titles and subheadings, are updated every 6-12 months, and offer a great reader experience: Semrush (2023)
- Google Analytics is the top content marketing ROI tracking tool: ProperExpression (2023)
- 48% of marketers spend under five hours a week writing content: Semrush (2024)
Our take: Comprehensive coverage, original research, a refresh habit and a clean reading experience is not a theorist’s list. It is the standard we hold Rankmax content to. This page is dated, sourced and reviewed on a six-month cycle for the same reason we refresh client money pages: compounding beats one-off publish spikes.
Channel and AI Search Statistics
These final statistics show how marketers are shifting channel investment as AI, owned audiences and visual content reshape content distribution.
- 81% of B2B marketers use AI for content tasks, up from 72% the previous year: CMI and MarketingProfs (2025)
- 46% of B2B marketers expect their content marketing budget to increase in 2025, while only 8% expect it to decrease: CMI and MarketingProfs (2025)
- 27% of B2B marketers expect their content marketing team to grow in 2025, rising to 38% among top performers: CMI and MarketingProfs (2025)
- 68% of B2B marketers increased their use of LinkedIn over the previous 12 months: CMI and MarketingProfs (2025)
- 22% of marketers said expanding from text-based content into visual or audio content was their most effective diversification strategy in 2025: HubSpot (2026)
- Nearly 75% of marketers use AI for media creation, including video and images: HubSpot (2026)
- Email marketing is used by 40% of marketers, tying with organic social media as the second most-used marketing channel across business sizes: HubSpot (2026)
- Website, blog and SEO is the top ROI-driving marketing channel, cited by 27% of marketers: HubSpot (2026)
- Website/blog/SEO remains the #1 ROI-generating channel, followed by paid social media at 26%: HubSpot (2026)
Our take: The channel stats are not saying “abandon search.” They are saying layer AI structure, visual formats and owned distribution on top of the assets that already earn demand. Our 2026 play for clients is the same as for this site: make the highest-value search pages easier to quote, easier to repurpose and easier to move into email and LinkedIn once they rank and get cited.
What These Statistics Mean for Your 2026 Content Strategy
Here is how we read the 180+ numbers above when we plan a content budget for a client or for Rankmax.
1. Depth beats volume: With 58.5% of searches ending in zero clicks and the top three results taking 54.4% of the rest, thin pages no longer earn their keep. Comprehensive content on fewer topics is the only format that reliably wins.
2. AI traffic is small but compounding, and worth more: Adobe recorded a tenfold rise in AI referral traffic in seven months. In our own work, AI search traffic converted at 6.24% against 3.29% for traditional organic. Structure content so AI engines can quote you, starting now.
3. Answer early: 44.2% of ChatGPT citations come from the first 30% of a page (Kevin Indig Growth Memo, Feb 2026). Lead with the answer, then expand. This serves Google, AI and voice search at once.
4. Original data is your moat: 93% of B2B content earns zero backlinks because it repeats what everyone already knows. Verifiable results and original numbers are what get linked and cited. Our most-cited client content is always built on real outcomes.
5. Page experience is a revenue lever: With over 60% of traffic on mobile, fixing Core Web Vitals lifted one client's organic revenue 91% in eight months and unlocked 126 AI Overview citations. Slow pages do not get cited.
6. Maintain what you publish: Around half of marketers who refresh content see ranking and traffic gains. Compounding comes from updating, not just adding.
7. Fund it properly or do not bother: The most successful companies put more than 10% of budget into content while most spend under $1,000 a month. There is no middle ground that works.
These patterns are the backbone of the methodology that has produced over $26M in attributed client revenue for the businesses we work with, across Google, AI Overviews, ChatGPT, Perplexity, Gemini and Copilot. The data tells you what works. The discipline to act on it is where the revenue actually comes from.
Frequently Asked Questions
What is a content marketing statistic?
A content marketing statistic is a measured data point about how content marketing performs, how widely it is adopted, how much businesses invest in it, or what outcomes it produces across channels like blogging, video, social media, email and search. The strongest statistics name their source and the year they were published, so you can judge how current and credible they are before acting on them.
Are these content marketing statistics current for 2026?
Most are drawn from 2024 and 2025 sources, which makes them the latest available data at the time of this review in May 2026. A handful are long-standing industry benchmarks that remain widely cited but originate from earlier years. Each statistic in this guide is tagged with the year of its source so you can tell current data from durable benchmarks, and we refresh the guide every six months.
Which content marketing statistic matters most for 2026?
If you only act on one, make it this: 44.2% of ChatGPT citations come from the first 30% of a piece of content. As AI search grows, content that answers the question early and clearly is what gets quoted and what earns the high-value traffic. It also happens to be exactly what Google and voice search reward, so it is the single highest-leverage change most teams can make.
How should you use these statistics to build a content strategy?
Start by benchmarking your current performance against the numbers most relevant to your channel mix, then identify your biggest gap, whether that is depth, AI readiness, page speed or refresh cadence. Prioritise the few changes with the highest return, fund them properly, and measure results against revenue rather than traffic alone. The closing synthesis section above lists the seven signals we would prioritise first.
About the Author
Want Insights Like This Fortnightly?

Our AI SEO strategies and tactics delivered fortnightly, including bonus trade secrets not shared anywhere else. No fluff. Just what's working right now. 5-minute read.


